April 12, 2021 | Category: Investments
The 10 years that ended December 31, 2019, saw the U.S. take center stage when it came to equity outperformance over its international counterparts, driven largely by investors’ expectations that the U.S. economy would grow faster (and it did). Will the next ten years be more of the same, or are there any signals indicating that a change in leadership will occur? A look inside the data reveals that a change may be on the horizon, and a globally diversified equity allocation may be rewarded in the coming years. Using a sum-of-parts framework to look at the drivers of that outperformance—valuation expansion, earnings growth, and U.S. dollar appreciation—Vanguard research found that the continued long-term outperformance of U.S. equities is unlikely.
Drivers:
- Change in valuations
Valuations can either contract (downward change) or expand (upward change). - Earnings growth
Earnings per share is a key metric of corporate profitability, and if valuations are constant, higher earnings growth rates will increase equity prices. - Dividend yield
Dividend yield represents the cash return to investors. - Foreign-exchange return
The foreign-exchange return applies to the foreign currency exposure that investors obtain by owning non-U.S. dollar-denominated assets.
Changes in valuations contributed the most to U.S. outperformance over the past decade that ended on December 31, 2019
Annualized return
Past performance is no guarantee of future returns. An index’s performance is not an exact representation of any particular investment, as you cannot invest directly in an index.
Notes: Data covers January 1, 2010 through December 31, 2019. The U.S. equity return is represented by the MSCI USA Index return; the international equity return is represented by the MSCI ACWI ex USA Index return.
Sources: Vanguard calculations, based on data from Thomson Reuters Datastream and Global Financial Data.
Will the next decade tell a different story?
This same framework can also be used to explain our forward-looking expectations. We believe investors will have lower return expectations for U.S. equities compared to international equities going forward, based on an inverse relationship between starting valuations and an expected valuation contraction in the U.S. over the next 10 years.
Valuation contraction in the U.S. is expected to drive excess returns internationally over the next 10 years
Annualized return
Notes: Forward-looking return estimates are from Vanguard Capital Markets Model®, as of September 30, 2020, for the period October 1, 2020 through September 30, 2030. The U.S. equity return is represented by the MSCI USA Index return; the international equity return is represented by the MSCI ACWI ex USA Index return.
IMPORTANT: The projections and other information generated by the Vanguard Capital Markets Model (VCMM) regarding the likelihood of various investment outcomes are hypothetical in nature, do not reflect actual investment results, and are not guarantees of future results. The distribution of return outcomes from VCMM is derived from 10,000 simulations for each modeled asset class. Simulations as of September 30, 2020. Results from the model may vary with each use and over time. For more information, please see the Notes section.
Sources: Vanguard calculations, based on data from Thomson Reuters Datastream and Global Financial Data.
Don't forget to look at starting valuations
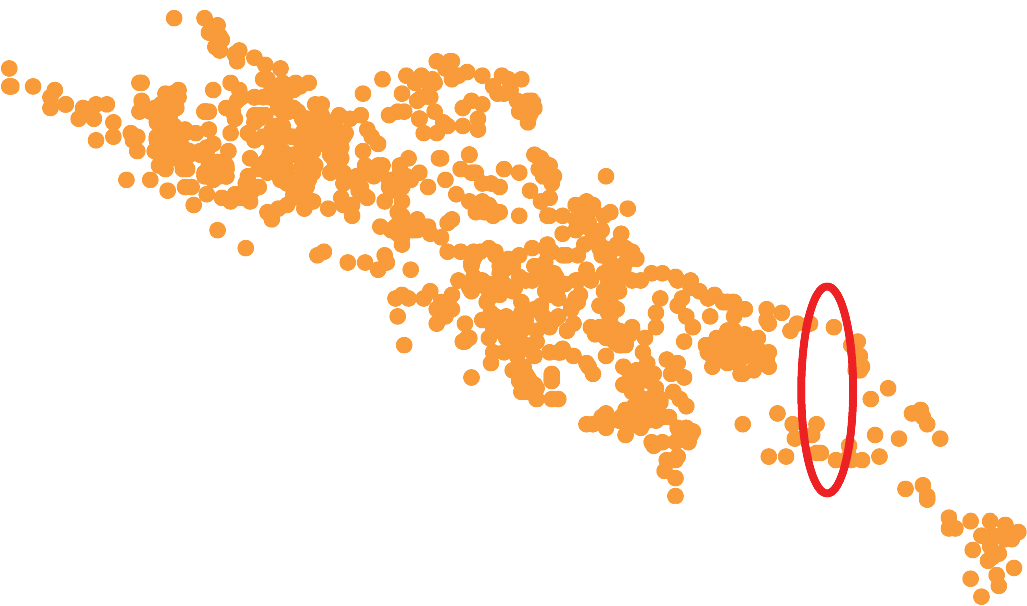
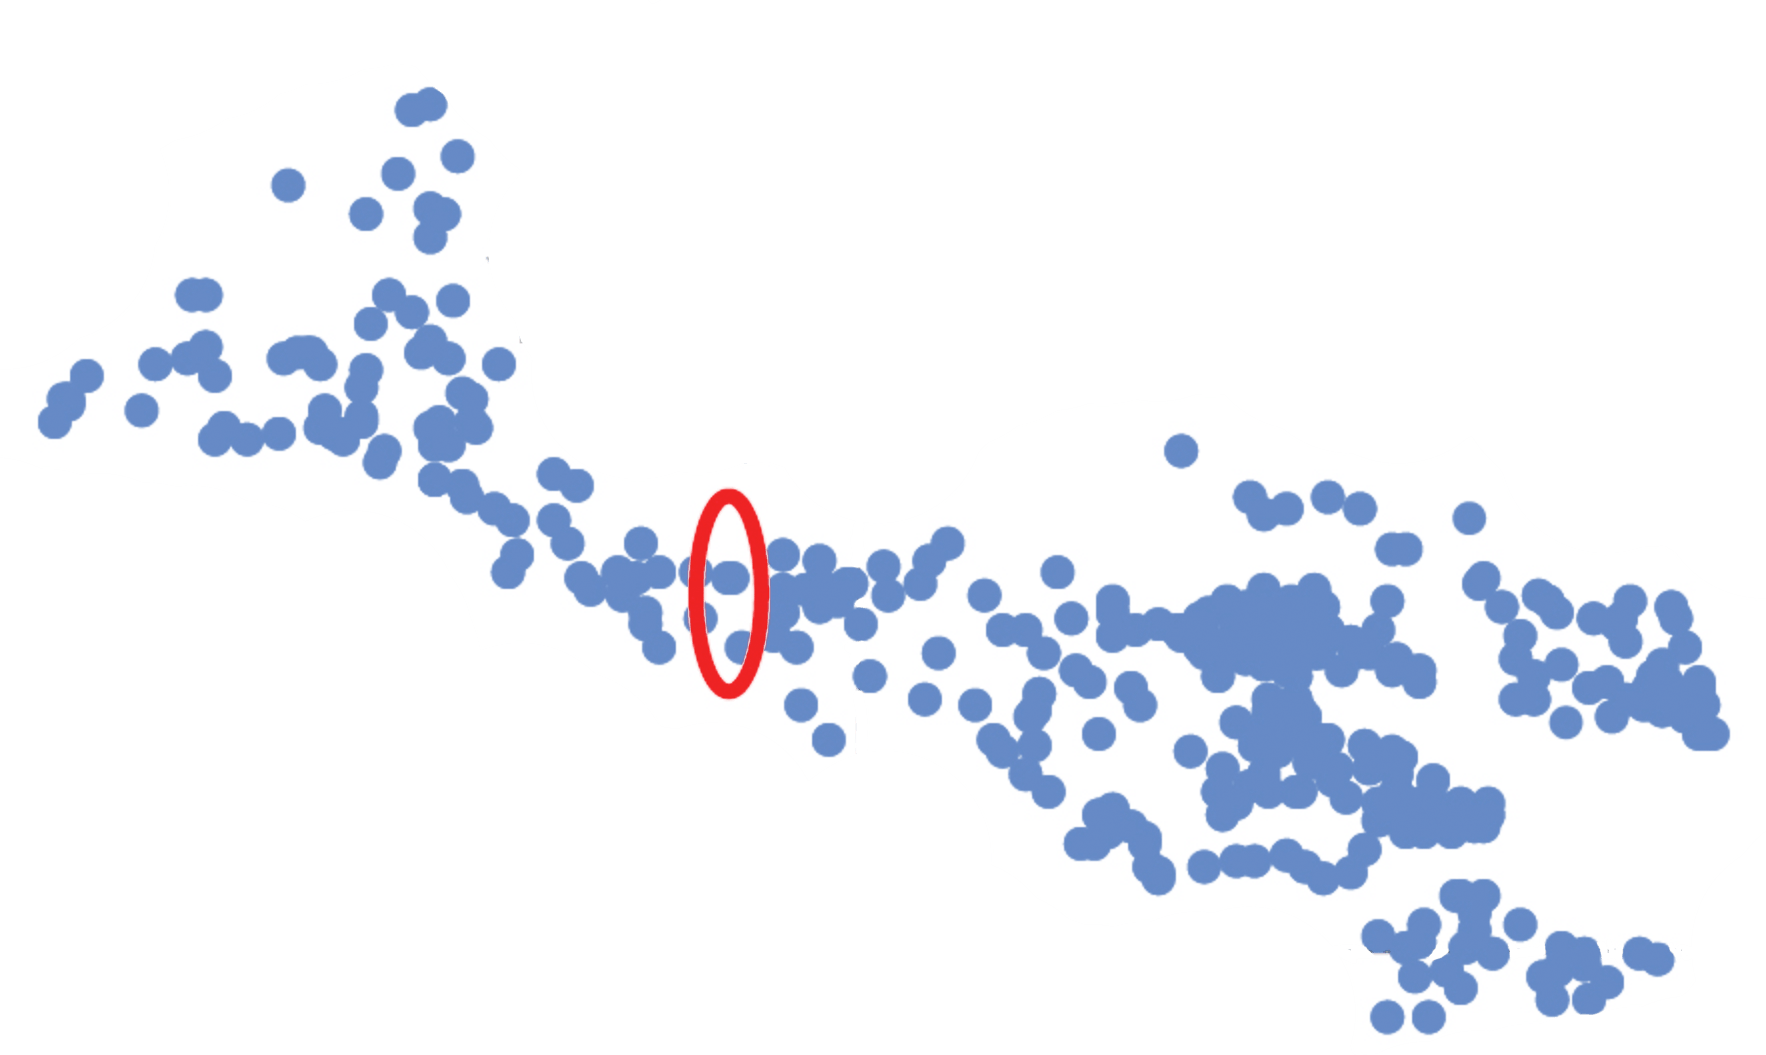
When looking at valuations, where you start has a lot to do with where you end up. When analyzing this key metric, generally the higher the starting valuation, the lower the expected 10-year return. As you can see in the charts below, U.S. equities clearly have much higher starting valuations than their international counterparts.
Inverse relationship between starting valuations and subsequent 10-year returns
U.S equities
10-year annualized return
Starting valuations (as measured by P/E ratio)
International equities
10-year annualized return
Starting valuations (as measured by P/E ratio)
Past performance is no guarantee of future returns. An index’s performance is not an exact representation of any particular investment, as you cannot invest directly in an index.
Notes: For U.S. equities, data covers October 31, 1938 through September 30, 2020. For international equities, data cover November 30, 1979 through September 30, 2020. Starting valuations are measured as the ratio of the broad equity market price to the 10-year rolling average of inflation-adjusted earnings (also known as the Shiller CAPE). For international equities, currency-adjusted returns are calculated by removing the effect of market-capitalization-weighted spot currency returns of the U.S. dollar relative to the Australian dollar, British pound, Canadian dollar, euro, and Japanese yen, on MSCI ACWI ex USA Index returns across time. Market-capitalization weights are based on the country composition of the MSCI ACWI ex USA Index. “You are here” marks the decade that ended on September 30, 2020.
Sources: For U.S. equities, Vanguard calculations, based on data from Standard and Poor’s and Robert Shiller’s website at aida.wss.yale.edu/~shiller/data.htm. For international equities, Vanguard calculations, based on MSCI ACWI ex USA Index data from Thomson Reuters Datastream.
Additional notes:
- All investing is subject to risk, including possible loss of principal. Diversification does not ensure a profit or protect against a loss.
- Investments in stocks issued by non-U.S. companies are subject to risks including country/regional risk and currency risk. These risks are especially high in emerging markets.
- The Vanguard Capital Markets Model (VCMM) projections are based on a statistical analysis of historical data. Future returns may behave differently from the historical patterns captured in the VCMM. More important, the VCMM may be underestimating extreme negative scenarios unobserved in the historical period on which the model estimation is based.
- The Vanguard Capital Markets Model is a proprietary Financial simulation tool developed and maintained by Vanguard’s primary investment research and advice teams. The model forecasts distributions of future returns for a wide array of broad asset classes. Those asset classes include U.S. and international equity markets, several maturities of the U.S. Treasury and corporate fixed income markets, international fixed income markets, U.S. money markets, commodities, and certain alternative investment strategies. The theoretical and empirical foundation for the Vanguard Capital Markets Model is that the returns of various asset classes reflect the compensation investors require forbearing different types of systematic risk (beta). At the core of the model are estimates of the dynamic statistical relationship between risk factors and asset returns, obtained from statistical analysis based on available monthly financial and economic data from as early as 1960. Using a system of estimated equations, the model then applies a Monte Carlo simulation method to project the estimated interrelationships among risk factors and asset classes as well as uncertainty and randomness over time. The model generates a large set of simulated outcomes for each asset class over several time horizons. Forecasts are obtained by computing measures of central tendency in these simulations. Results produced by the tool will vary with each use and over time.
The information provided is for educational purposes and for your independent consideration. This information does not contain, constitute or provide individual tax, financial, or investment advice. This material should not be considered as a recommendation of any particular security, strategy or investment product or service. Particular investment or trading strategies should be evaluated relative to each individual’s objectives and risk tolerance. Readers are urged to seek professional advice with respect to their specific financial, legal, tax, and investment matters.
Brokerage services are offered through Popular Securities, LLC, registered broker/dealer, member FINRA & SIPC. Investment advisory services are provided through Popular Securities, LLC., a registered investment adviser. Popular Securities, LLC is a subsidiary of Popular, Inc. and is affiliated with Banco Popular de Puerto Rico. Popular Inc. and Banco Popular de Puerto Rico are not registered broker/dealers nor registered investment advisers. Popular One is a platform of integrated financial services centered on you through which Popular Securities services are offered. Investment products are not insured by the FDIC; are not deposits or obligations of the bank; are not guaranteed by the bank or its subsidiaries and/or affiliates; and are subject to investment risks, and they may lose value.
Wealth Management services are generally available to clients who maintain deposits and/or investments of $500,000 or more at Popular.
 Puerto Rico


